How to Create charts with PHP
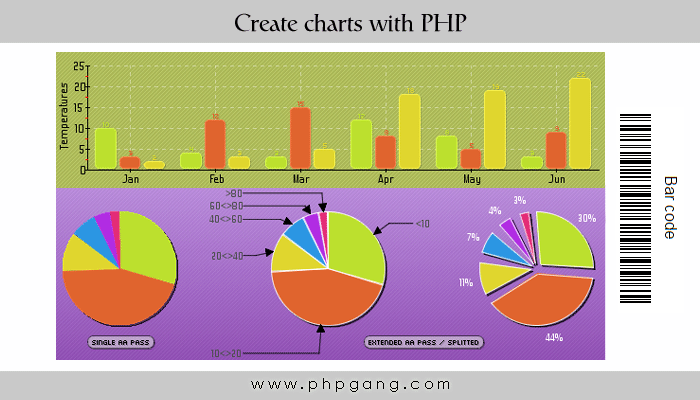
Charts give a pictorial representation of information. Using PHP we can create beautiful charts to provide the user with graphical representation of the data. In this article you will see how we can create bar, line and pie charts using PHP pcharts library. Pchart is a php class oriented framework designed to create charts directly from the web server.
What is pchart library?
Pchart is a php class oriented framework designed to create charts directly from the web server. It requires GD library so make sure your server supports it. Using pcharts you can draw various kinds of charts like bar, line, area, pie, scatter, split, stacked. It has also feature to draw barcodes. Cool isn’t it.
Steps to install pcharts in your server
Installation of pcharts is very simple. Go to its download page to download the latest version, currently 2.1.4. After the download extract the zip/tar/tar.gz file in your local/online server. The file contains the class files and various examples to get you started. Create a folder with any name to store the chart images. I have used charts_images folder to store temporarily chart images.
Creating a bar chart
The first step to create a bar chart is to include the libraries.
<?php
include("./class/pData.class.php");
include("./class/pDraw.class.php");
include("./class/pImage.class.php");
Then you have to create an object of the pdata class. You can add multiple data for comparison or single data based on your requirements.
<?php

$MyData = new pData();
$MyData->addPoints(array(10, 4, 3, 12, 8, 3), "Data 1");
// second
$MyData->addPoints(array(3, 12, 15, 8, 5, 9), "Data 2");
// third data
$MyData->addPoints(array(2, 3, 5, 18, 19, 22), "Data 3");
$MyData->setAxisName(0, "Temperatures");
$MyData->addPoints(array("Jan", "Feb", "Mar", "Apr", "May", "Jun"), "Labels");
$MyData->setSerieDescription("Labels", "Months");
$MyData->setAbscissa("Labels");

?>
Drawing the chart and displaying on browser
<?php

/* Create the pChart object */
$myPicture = new pImage(700, 230, $MyData);

/* Draw the scale and the chart */
$myPicture->setGraphArea(60, 80, 600, 190);

/* Write the chart legend */
$myPicture->drawLegend(630, 80, array("Style" => LEGEND_NOBORDER, "Mode" => LEGEND_VERTICAL));

/* Render the picture (choose the best way) */
$myPicture->autoOutput("charts_images/example.drawBarChart.png");

?>
Creating a pie chart
To create a pie chart use the code below, it is very similar like bar charts with minor changes. You can create 2d as well as 3d pie charts. You have to call different methods for using them.
<?php
 include("./class/pData.class.php");
 include("./class/pDraw.class.php");
 include("./class/pPie.class.php");
 include("./class/pImage.class.php");

/* Create and populate the pData object */
 $MyData = new pData();
 $MyData->addPoints(array(40,60,15,10,6,4),"ScoreA");
 $MyData->setSerieDescription("ScoreA","Application A");

/* Create the pChart object */
 $myPicture = new pImage(700,230,$MyData);

/* Create the pPie object */
 $PieChart = new pPie($myPicture,$MyData);

/* Draw a simple pie chart */
 $PieChart->draw2DPie(120,125,array("SecondPass"=>FALSE));
/* Write the legend box */
 $myPicture->setFontProperties(array("FontName"=>"./fonts/Silkscreen.ttf","FontSize"=>6,"R"=>255,"G"=>255,"B"=>255));
 $PieChart->drawPieLegend(380,8,array("Style"=>LEGEND_NOBORDER,"Mode"=>LEGEND_HORIZONTAL));

 /* Render the picture (choose the best way) */
 $myPicture->autoOutput("charts_images/example.draw2DPie.png");
?>
Creating a bar code
To create a barcode see the code below. It’s very simple all you have to do is include the required class file and then create an object. Set the string that needs to be coded and finally display the barcode.
<?php
/* pChart library inclusions */
 include("./class/pDraw.class.php");
 include("./class/pBarcode128.class.php");
 include("./class/pImage.class.php");

 /* Create the barcode 128 object */
 $Barcode = new pBarcode128("./");

 /* String to be written on the barcode */
 $String = "This is a test";

 /* Retrieve the barcode projected size */
 $Settings = array("ShowLegend"=>TRUE,"DrawArea"=>TRUE);
 $Size = $Barcode->getSize($String,$Settings);

 /* Create the pChart object */
 $myPicture = new pImage($Size["Width"],$Size["Height"]);

 /* Set the font to use */
 $myPicture->setFontProperties(array("FontName"=>"./fonts/GeosansLight.ttf"));

 /* Render the barcode */
 $Barcode->draw($myPicture,$String,10,10,$Settings);
 /* Render the picture (choose the best way) */
 $myPicture->autoOutput("charts_images/example.barcode128.png");
?>
Check the live demo for working sample. More example to create line charts, area charts other different kind of charts are included in the source code.
I hope this article helps you creating charts, Feel free to give your comment below.
Tutorial Categories: